Company
Bulb
Position
Lead designer
Driving a 14% increase in app usage with smart insights and behavioural design
A 198k user experiment driving engagement through smart energy insights

In 2022, following the onset of the UK energy crisis, Bulb entered special administration. With the government seeking a buyer and wholesale prices exceeding the trade cap, members were facing 54% increases in their bills.
Our team focused on improving engagement to help members manage costs, raise the product’s perceived value, and support potential operational savings by encouraging smart meter data sharing.
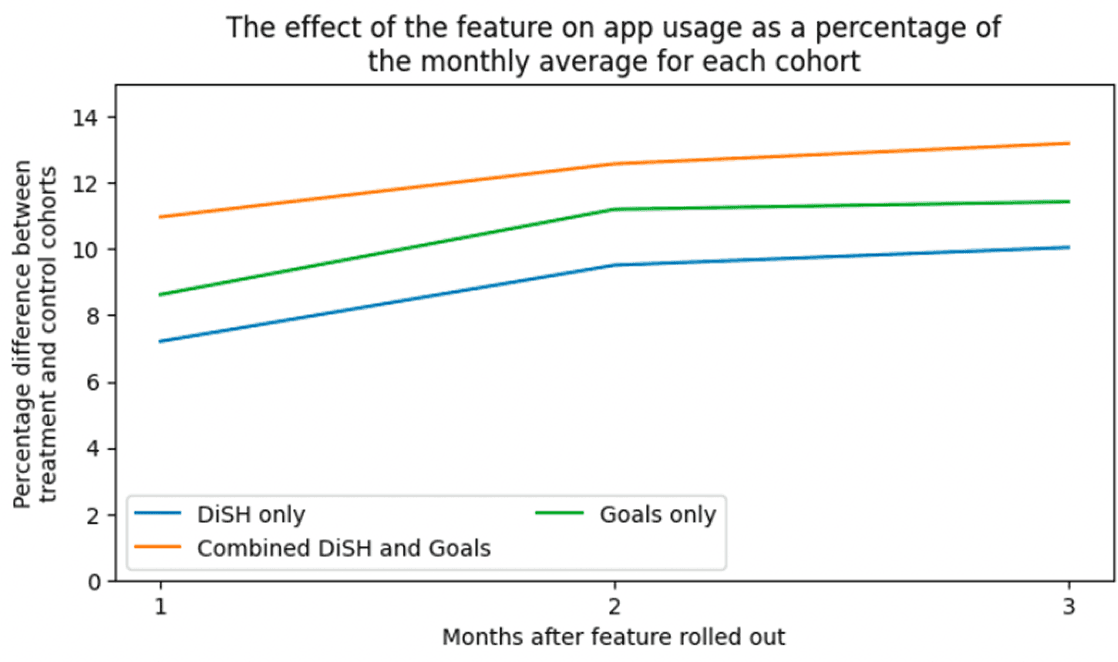
We rolled this out to over 140,000 members through a staged experiment, with a 14% uplift in engagement among users who received the feature.
As lead designer on Smart Insights, I owned the experience from early discovery through delivery — balancing user research, behavioural strategy, system integration, and cross-functional alignment.
Facilitated cross-functional workshops with data science, engineering, and product to align on behavioural strategy.
Shaped experimentation structure with PM and data lead.
Drove iterative design and evaluation, using both user feedback and behavioural data to refine how we surfaced insights and set goals
Users wanted to feel in control
Past research showed peace of mind came from knowing what’s going on. This was especially true during the energy crisis.
Usage breakdowns were wanted
During concept testing, showing usage breakdown by categories like heating and cooking was one of the most popular ideas with a test group.
Comparisons drove action
Studies showed that comparing energy use to similar homes reduced consumption by 3-12%, motivating members to adopt energy-saving behaviours
Usage breakdown and comparisons were consistently top-performing ideas in concept tests — so we prioritised these for MVP.
Direction
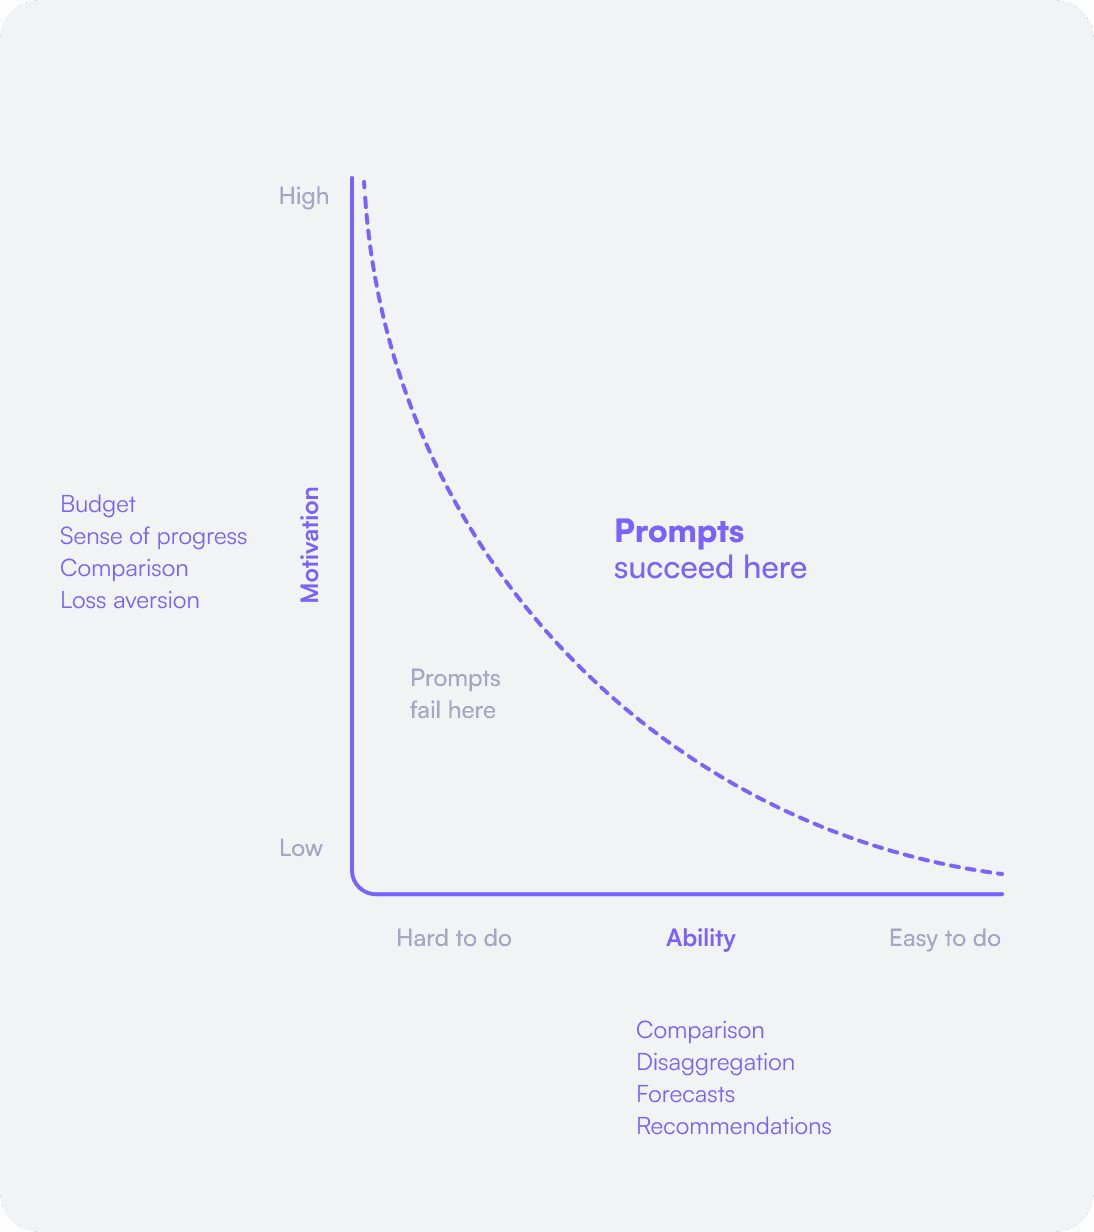
These elements worked together in a continuous loop of feedback and progress, designed to create engagemnet and build new energy habits.


First release
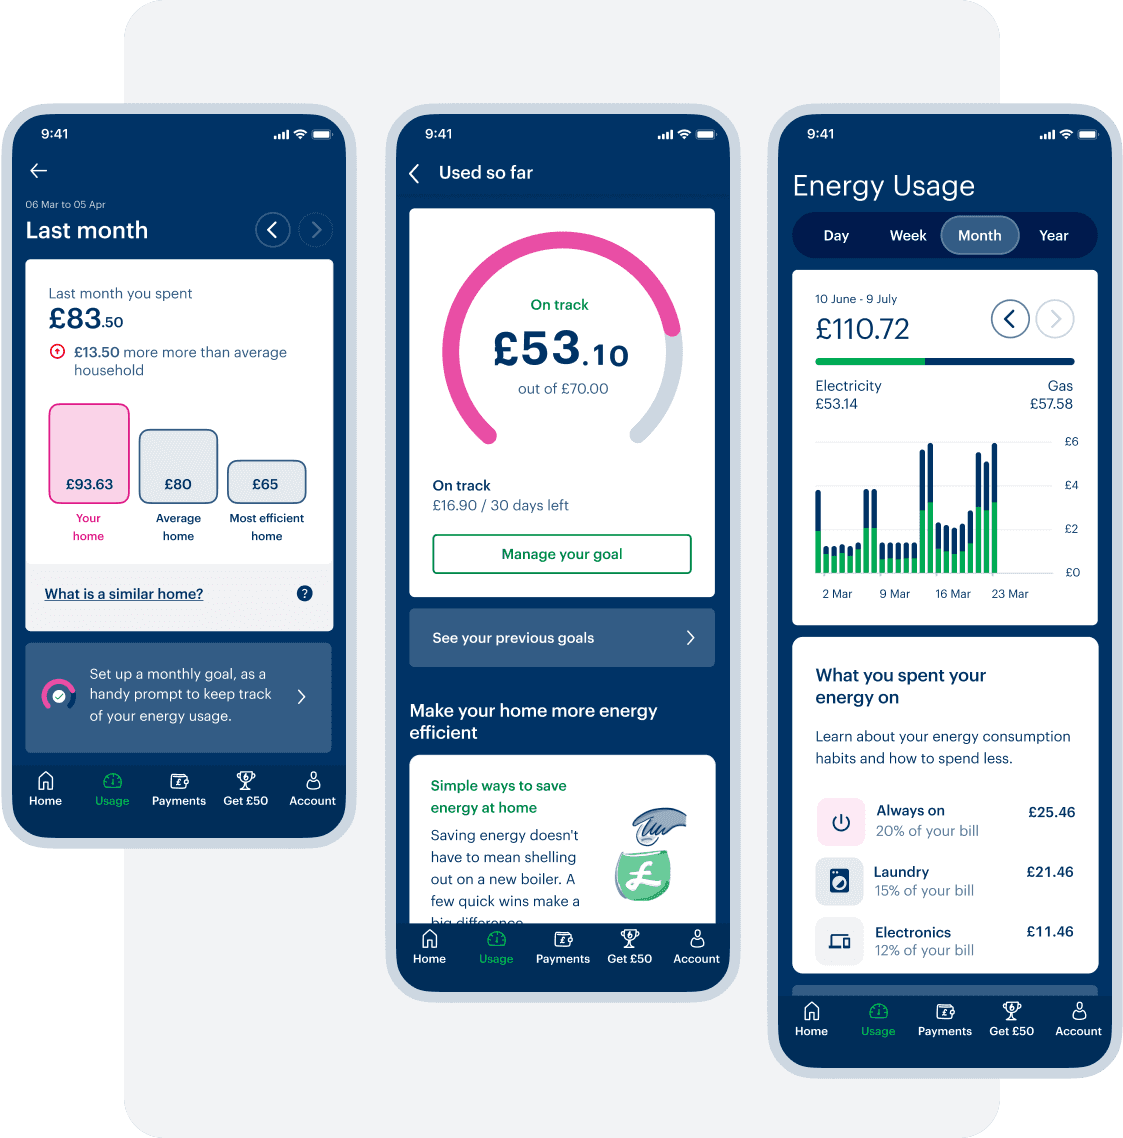
What we introduced
A new home screen module showing where members spent the most energy
Usage categories to provide a clear breakdown of members' energy bills
Comparisons to similar households

What we improved next
Added simple definitions of ‘similar homes’
Introduced tooltips and explanations to build confidence in the data
Released in stages across ~113,000 members
What we introduced
A short survey to collect home profile details and improve data accuracy
A progress bar and gentle reminders to encourage completion
Fixes for earlier bugs and issues raised in testing
What we learned
✅
41% completed the survey — members were motivated to improve accuracy
✅
Transparency around the data improved trust
⚠
Some found the onboarding slightly cumbersome
What we improved next
→ Made the survey easier to access
→ Highlighted the benefits of completion throughout the experience

Rolled out to ~46,000 members
What we introduced
What we learned
✅
The goals page was visited in over half of all sessions
✅
Around 25% became regular users who checked their progress
⚠
Some wanted to compare their goals with similar homes

Usage breakdown + Similar homes data
Released in stages across ~113,000 members
Goals
Rolled out to ~46,000 members
Combined
Largest group to test the full experience
Control group
33,000 member who didn't receive Smart Insights
App views increased by 14% among users who received the new features, with the highest engagement seen in users who had access to both features.
41% completed profile survey - indicating high level of interest, even though long survey
25% became regular goal users
Refine Eliq’s data quality
Continue to identify and fix inconsistencies in Eliq’s data to build trust and resolve member concerns.
Complete the behaviour model
Add personalised recommendations to not only foster behaviour change but also provide important, tailored content that resonates with users.
Boost goals adoption
Increase the uptake of goals by combining them with similar household comparisons (e.g., "Most similar homes use less energy—set this as an achievable goal").
Increase frequency of usage engagement
Utilise 10-second data to present usage insights on a daily basis instead of monthly, encouraging more frequent interaction and proactive energy management.